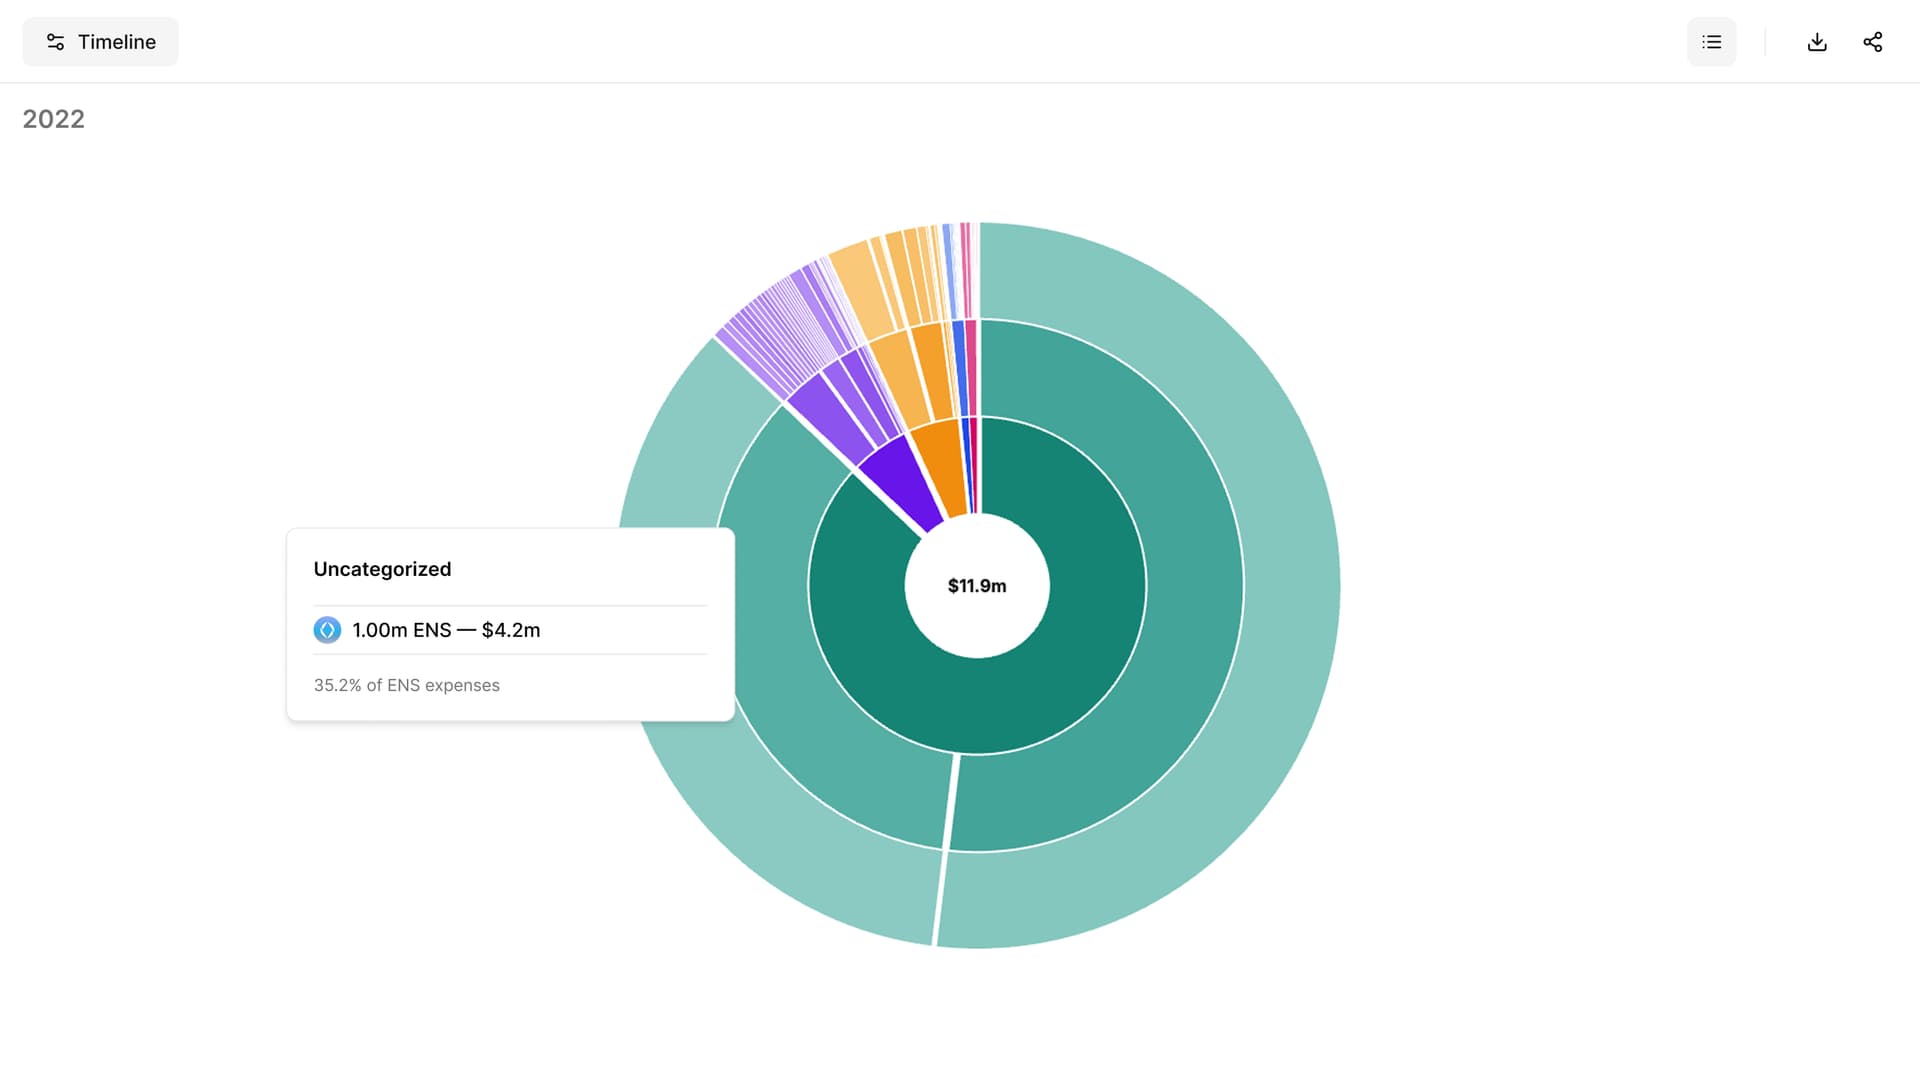

Track change over time
Spot trends, shifts, and unusual periods across transactions, balances, and flows.
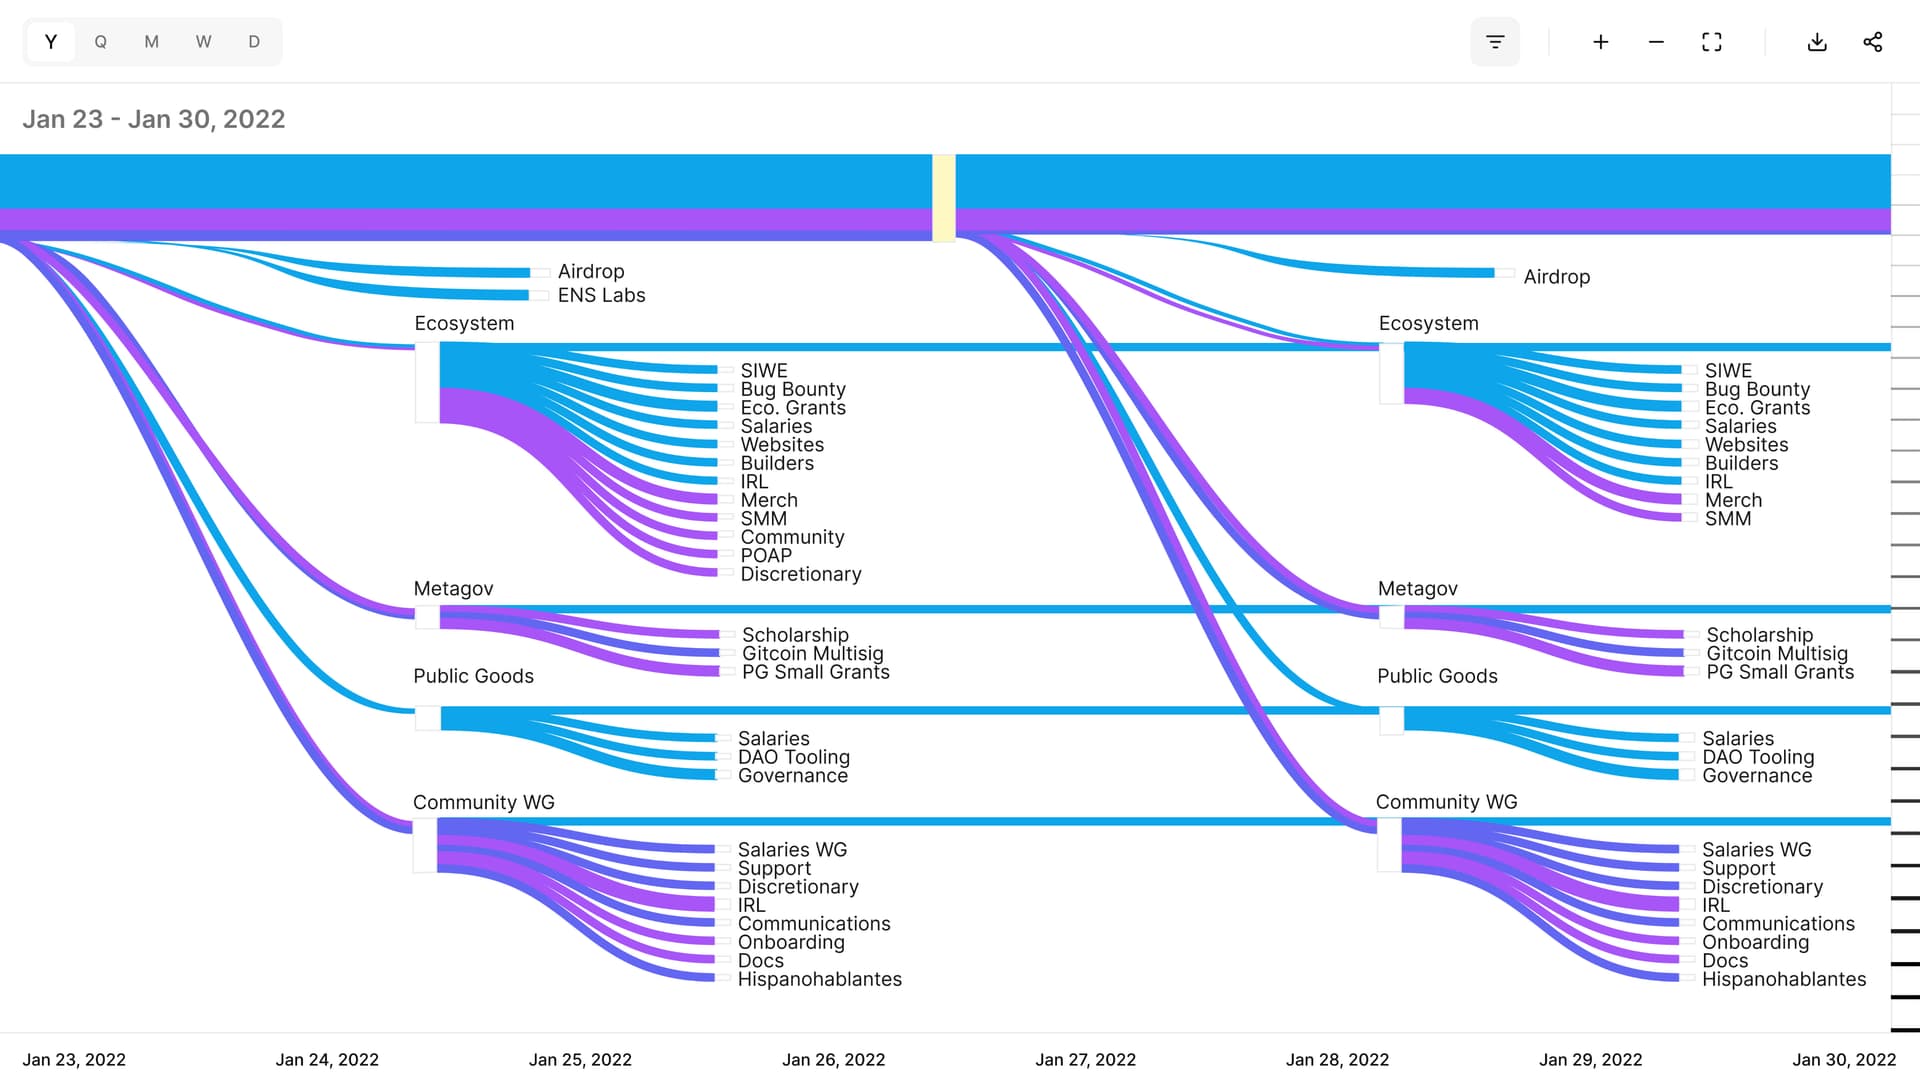
From wallet balances to flows between organizations, explore data in context and at different levels of detail.
Spot trends, shifts, and unusual periods across transactions, balances, and flows.
Break down the total and identify the biggest drivers of change.
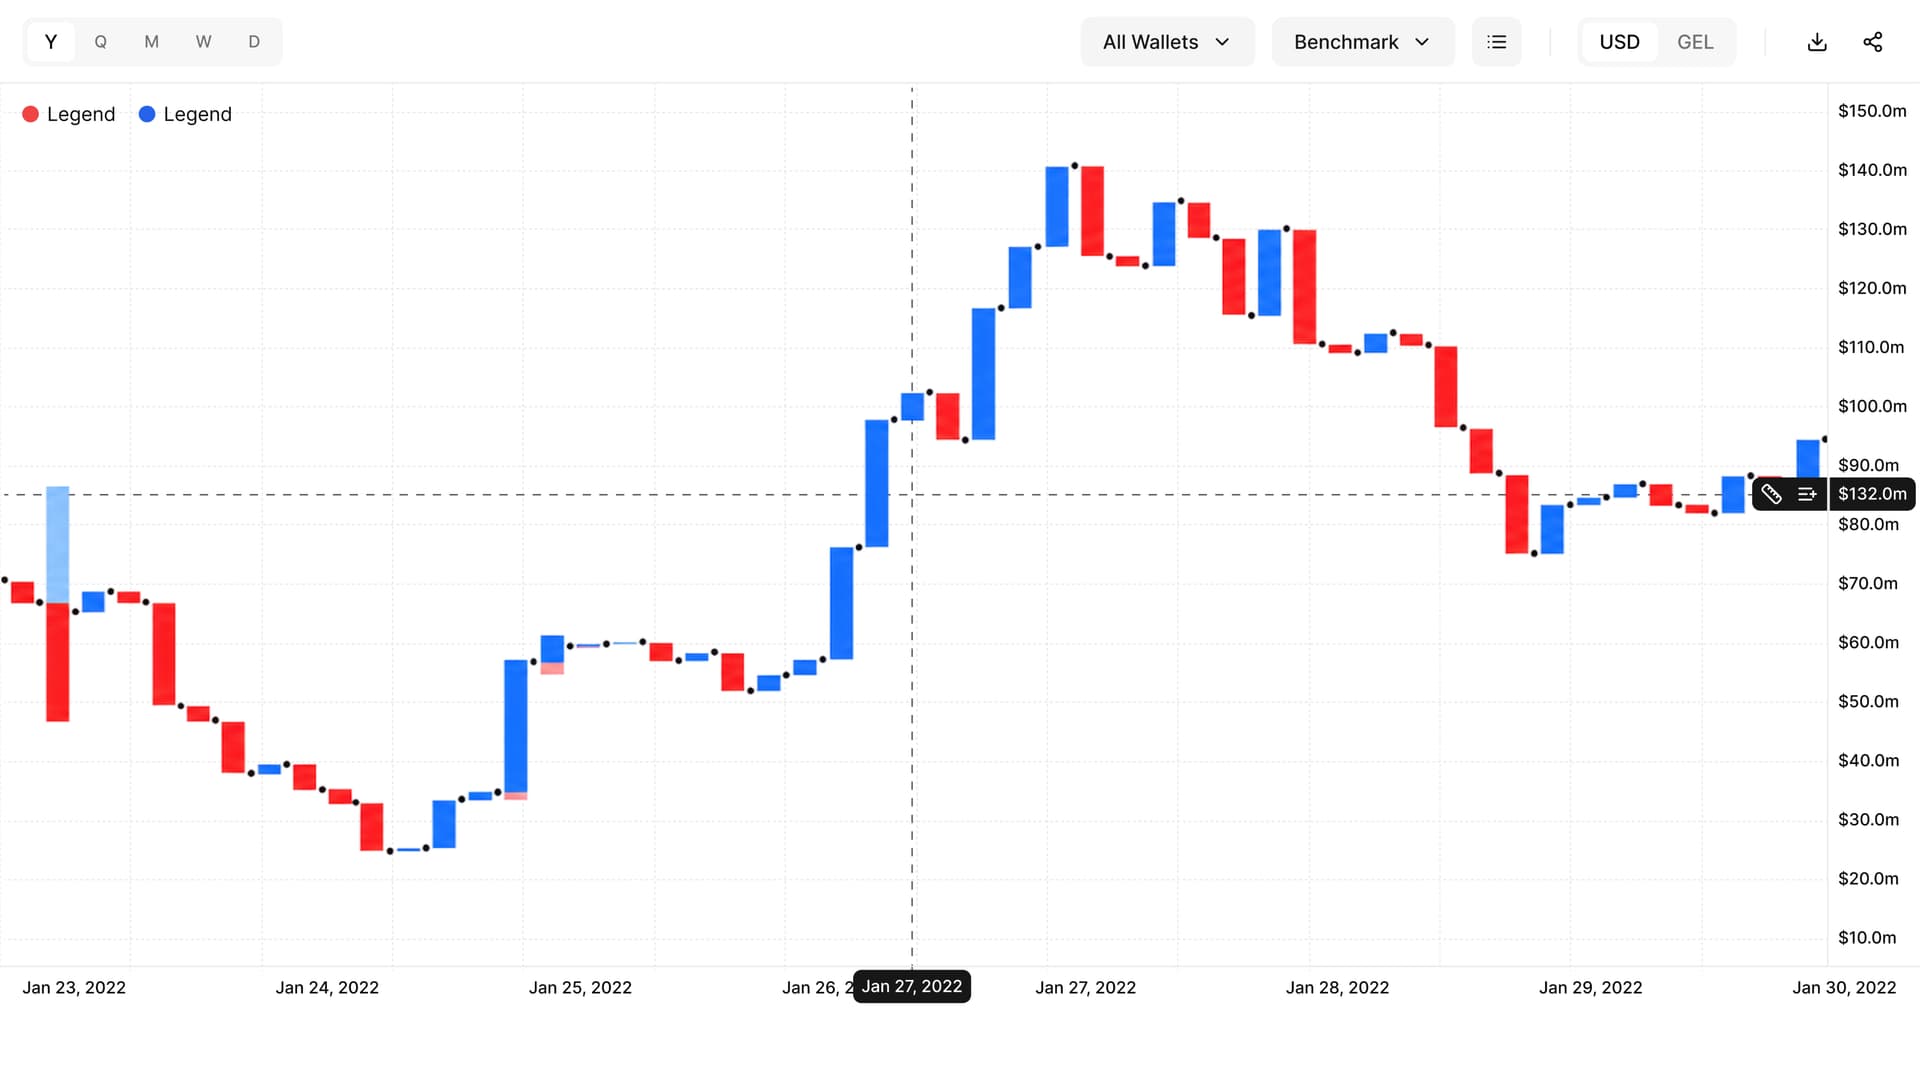
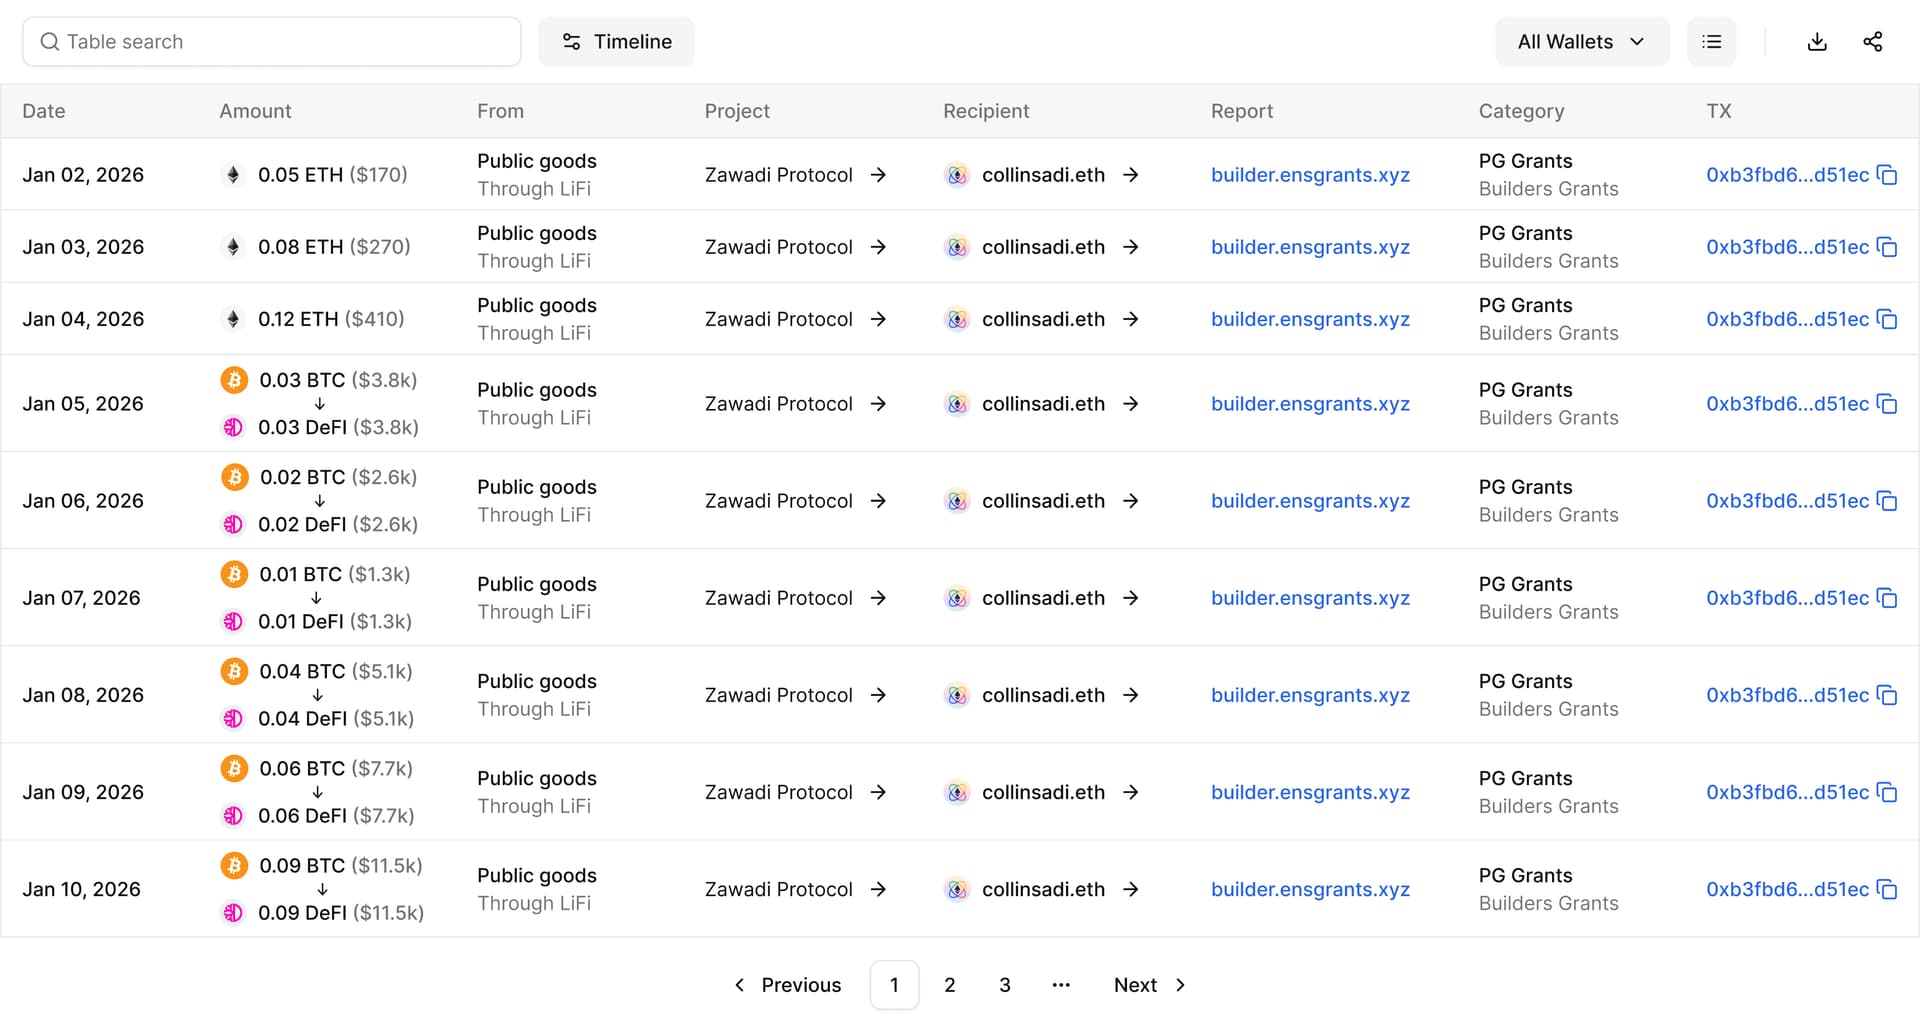
Study the exact values and move from visual patterns to the original data.
Explore how assets and categories combine to make up the whole.